Video-based Blood Flow Analysis
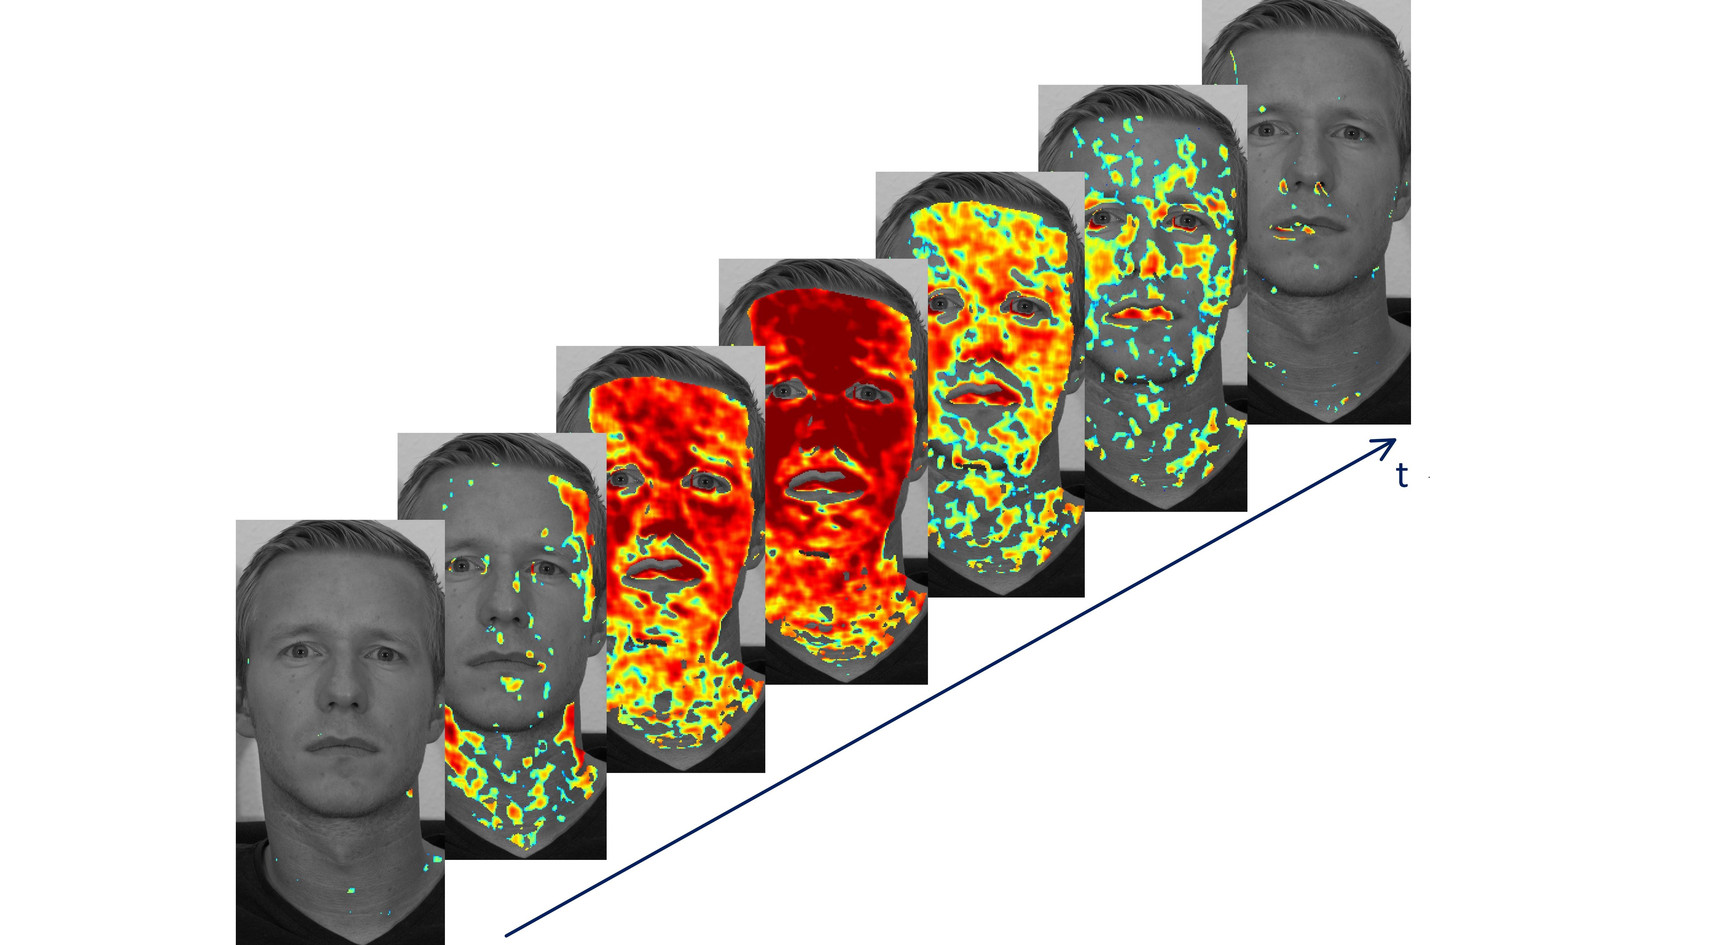
The contactless extraction of global vital signs (e.g. heart rate, respiration rate) from video recordings of a person has attracted much attention over the last years. Such extraction relies on the optical measuring technique photoplethysmography (PPG) which is commonly used to measure the human pulse rate and oxygen saturation using a pulse oximeter. The principle of PPG is based on the fact that blood absorbs more light than surrounding tissue, so variations in blood volume can be detected accordingly by a sensor. Therefore, the contactless measurement of vital signs with a regular camera is referred to as remote photoplethysmography (rPPG). In our research, we examine the time differences between distinct spatial regions using rPPG. Throughout our work, we implemented a method to analyze and visualize the local blood flow through human skin tissue within the face and neck. This method is based on the local rPPG signal characteristics and analyses the local propagation of blood flow from RGB-video recordings.

Figure 1: Visualization of the blood flow through the face of a male subject.
Human Physiology
The human heart generates a blood volume pulse (BVP) with each beat and is the source of the blood circulation. The resulting blood flow through the circulatory system leads to a continuous change in skin color. This effect can be observed more strongly when a person is physically active, e.g., after climbing stairs. The heart rate rises and the face color is getting redder. However, this constant color change is mostly imperceptible for the human eye. With rPPG techniques, this color variation is detected from a video, and the pulse rate can be determined.
Workflow
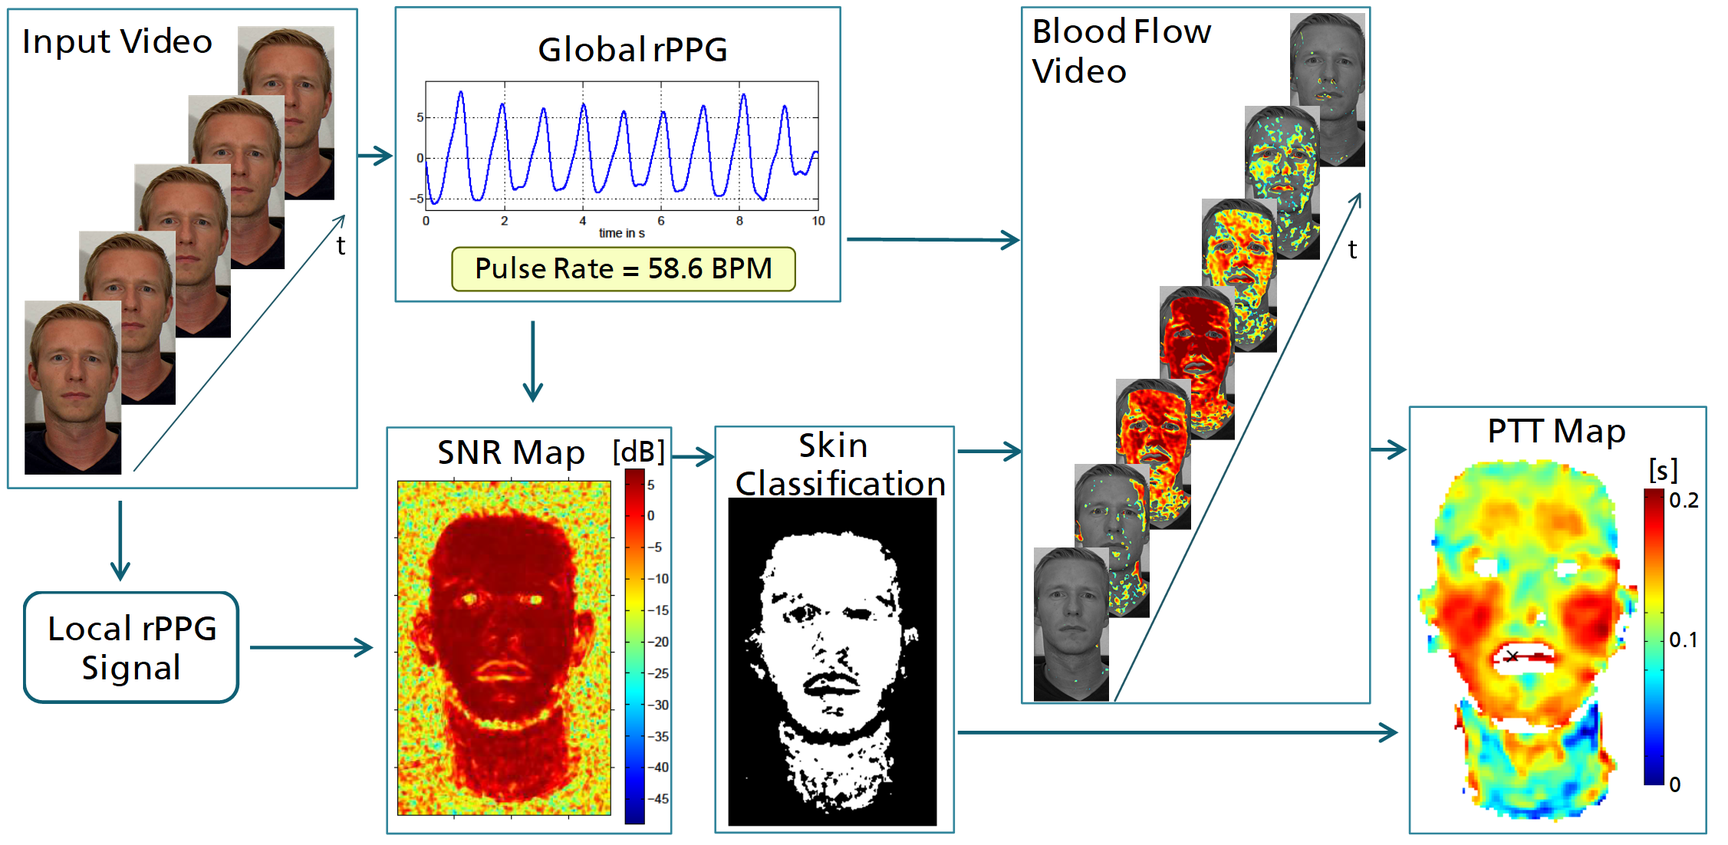
Figure 2 shows the general overview and illustrative results of our local rPPG signal analysis. In the first step, the global heart rate fhr is estimated from the input video sequence. We then calculate for each spatial position of the sequence, a local rPPG signal that is presented by a chrominance based signal. From this local rPPG signal the signal-to-noise ratio (SNR) map is generated. The following analysis is performed on pixel positions representing living skin tissue. The required skin classification (see Figure 2) is obtained after applying a threshold to the SNR map. The threshold is determined from the statistics of the histogram of all calculated SNR values. The local rPPG signal is further analyzed and then used to extract the local blood flow propagation for each as skin classified position. Furthermore, we visualize the blood flow path through the skin tissue via a Pulse Transit Time (PTT)map. We assume that the time delay corresponds to the time difference required by the peak of the BVP to reach different regions and thus corresponds to PTT. Therefore we calculate the time difference between rPPG signals of different spatial positions via the phase angle of the pulse frequency component in the frequency domain. The resulting PTT map in Figure 2 shows, where the BVP reaches first in time (blue indicates a region where the pulse appears early). The generated maps are used to visualize the propagation of the blood flow (PTT) and reveal the signal quality of each spatial position (SNR).
With the binary skin classification map, we further proved a novel living skin segmentation method, that is based on the global pulse rate and the statistical properties of the SNR map. This skin segmentation method allows a direct application in liveliness detection, e.g., for presentation attack detection (PAD).

Figure 2: Video-based bloodflow visualization workflow.
Application to Presentation Attack Detection
The use of a facial recognition system for authentication has become widespread. Biometric authentication systems based on facial recognition are already used in automatic border control systems (ABC-Gate) and to unlock smartphones. Although widely used and highly accurate, facial recognition algorithms suffer from vulnerability to simple spoofing attacks. An attack on face recognition based security systems are stated as a biometric presentation attack. Such an attack is the attempt to bypass a biometric security system by impersonating a target victim holding the desired authorization. During such presentation attacks, the security system may not be able to distinguish between the biological trait of the authorized person and the presented object.
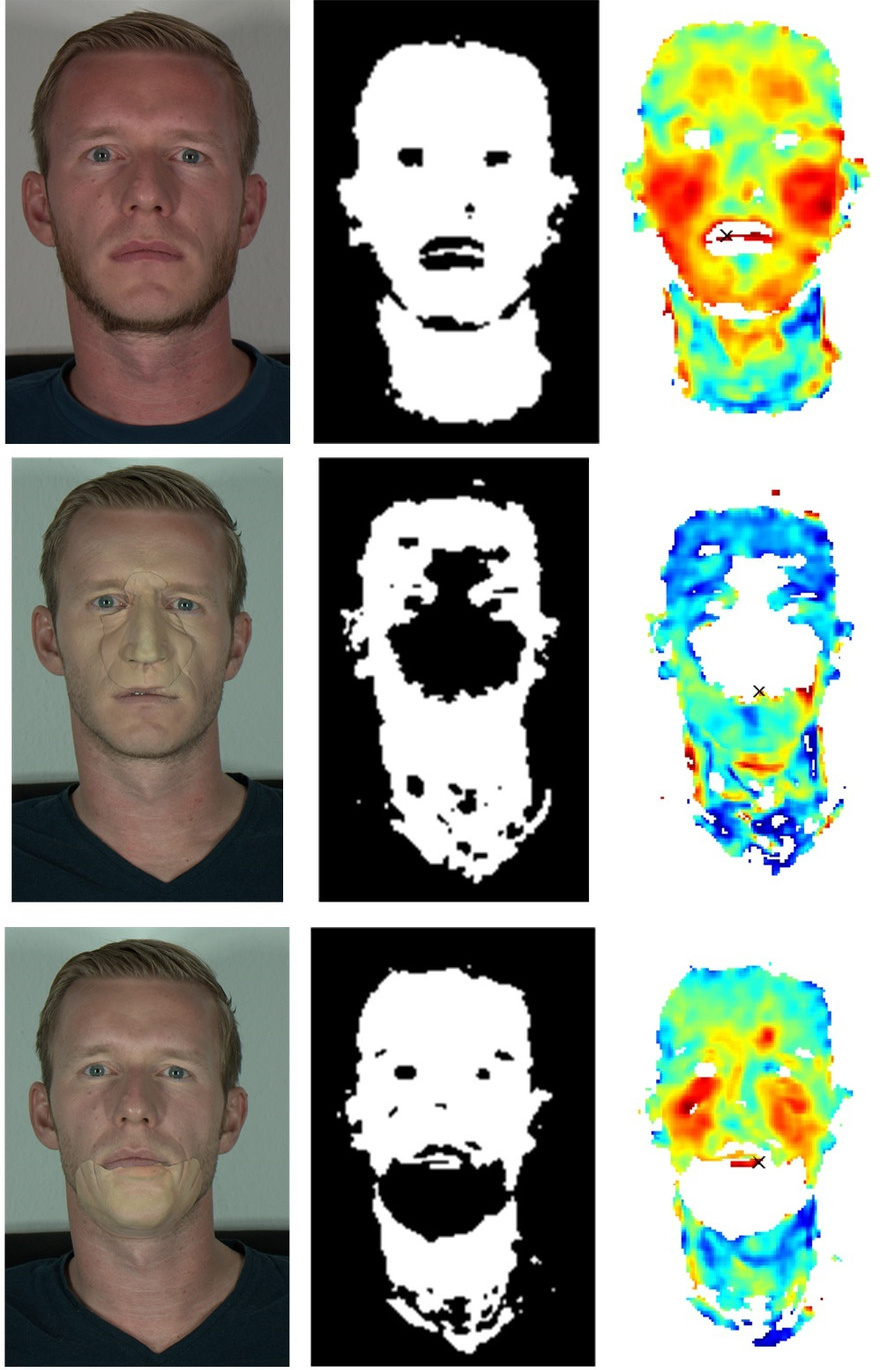
Based on our research results with the above-mentioned analysis and skin segmentation, we developed a new PAD system, that specializes in identifying a partial face and neck coverage in the video. The system is tested using datasets showing a person with different facial coverings, such as a mask or a thick layer of makeup. Figure 3 shows the results of three tested video sequences. In two of the resulting SNR and PTT maps, the presence and shape of the face coverage are is clearly visible.

Figure 3: This figure shows the results for three different video sequences. The first column shows one frame of each sequence. The second and third column shows the resulting skin classification and the PTT map. From top to bottom: no mask, nose mask, chin mask. The respective resulting skin classification and PTT maps clearly show the location and shape of the mask.
Conclusion
Further potential applications of the blood flow analysis include physiological measurements in medical applications, e.g., intraoperative blood flow visualization. It is also conceivable that the presented analysis and visualization can be used to differentiate between different soft tissues during surgery. With our research, we contribute a new approach to the analysis and visualization of local blood flow based on a chrominance-based rPPG signal. Besides, we present a novel method for the segmentation of living skin tissue in the face and neck. This segmentation relies on the pulse rate of the recorded subject and the SNR of the local rPPG signal.
Publications
B. Kossack, E. Wisotzky, A. Hilsmann, P. Eisert Local Remote Photoplethysmography Signal Analysis for Application in Presentation Attack Detection, Vision, Modeling and Visualization Workshop, Rostock, Germany, Oct. 2019.
B. Kossack, E. Wisotzky, R. Hänsch, A. Hilsmann, P. Eisert Local Blood Flow Analysis and Visualisation from RGB-video Sequences, 53rd Annual Conference of the German Society for Biomedical Engineering (BMT 2019), Frankfurt, Germany, Sep. 2019.
